
Alarms and events allow you to monitor the health of your application network. Certain alarms and events trigger notifications that are delivered to you via SMNP traps and/or emails to specified addresses (depending on how you have configured the Alerts tab of a Location's Location form). The Alarms and Events feature allows you to keep track of these alerts directly in App Net Manager.
An alarm is generated when a problem that affects service is detected by the system. With every alarm, there is an associated clearing notification that is generated when the problem has been resolved. Alarms indicating a current problem are listed in the Active Alarms category; when an alarm has cleared, it is listed in the Cleared Alarms category.
An event is generated when something has happened within the system that generally does not affect service but still requires attention. A clearing notification is not generated for an event. Events are listed in the Events category.
For ease of viewing, you can sort the alerts in each category of this feature by four (4) different methods. When you right-click Alarms and Events in the domain directory and highlight Sort Alarms/Events, you can select from the following options:
By Day: Sort alerts by date. This option will be selected by default.
By Class: Sort alerts by the class of alert.
By Code: Sort alerts by alert code.
By Source: Sort alerts by the source of the alert (i.e., a Location or Client).
When you select Alarms and Events in the domain directory, the number of Active Alarms, Cleared Alarms, and Events that are currently stored for this domain in App Net Manager will be displayed in the table on the right side of the interface.
Depending on the level of permissions that your administration account has been granted, you may or may not have access to the Alarms and Events feature.
Like reports, you can forward any alarm or event that is displayed on this interface to the email address(es) that you specify. Simply right-click the alarm or event, select EMail…, and fill out the screen that is displayed. For more information, refer to Section 1.10.1, “Sending Reports via Email”.
If a Q appears on the icon for an alarm or event, this indicates that the alarm was Queued to be displayed on the App Net Manager interface. This means that the issue that caused the alert occurred while the affected Location was not connected to the Corente SCP. As soon as the Location was able to contact the Corente SCP, the alert was generated and displayed on the interface, and the email notification (if applicable) was sent. The date and time of the alert reflect the date and time when the Location was able to contact the Corente SCP.
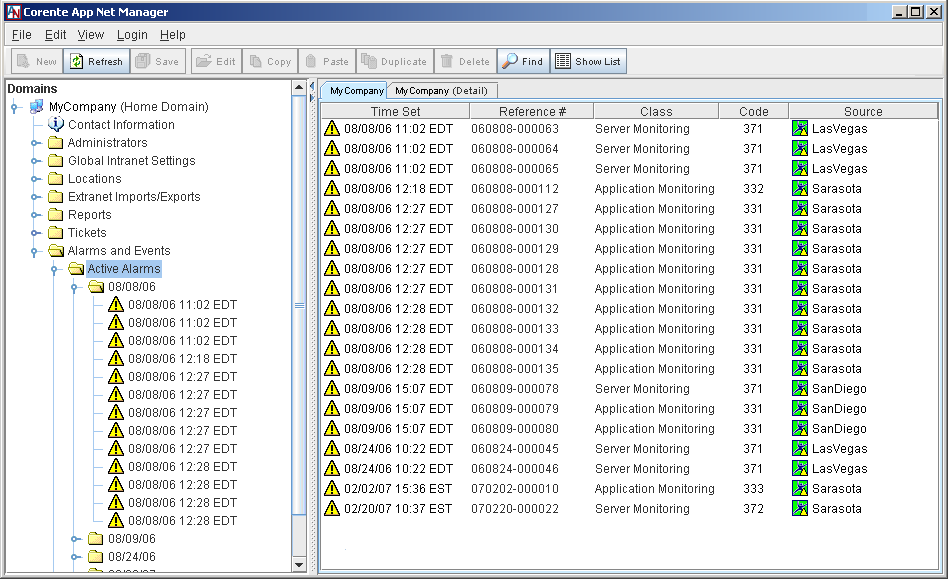
When you select Active Alarms, all of the current alarms are listed in a table on the right side of the interface. This table displays:
Time Set: the date and time when the problem was detected and the alarm was first generated
Reference #: the unique reference number assigned to the alarm for identification purposes
Class: the category of alarm that was generated
Code: the code number corresponding to the type of alarm that was generated
Source: the Location or Client generating this alarm
You can click each of these headings to sort the alarms in the table by that heading.
When you open the Active Alarms branch in the domain directory, your active alarms will be sorted in the domain directory according to the Sort option that you have selected. Alarms will be listed in the Active Alarms category until they have been cleared.
To view detailed information about an active alarm that is listed on this interface:
Double-click the alarm in the table on the right side of the interface.
Double-click the alarm in the domain directory.
Right-click an alarm in the domain directory and select Edit.
Select an alarm in the domain directory and select Edit from the tool bar or the Edit menu.
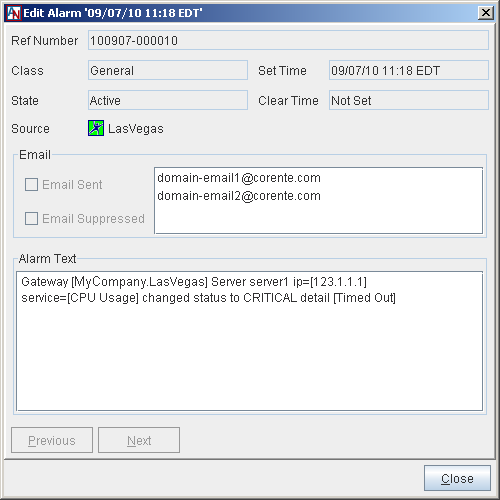
A window will be displayed that further explains this particular alarm:
Ref Number: The unique reference number assigned to this alarm for identification purposes.
Class: The category of alarm that was generated.
State: The entry in this field will be Active, to denote that this is a currently active alarm.
Source: The Location or Client that is generating this alarm.
Set Time: The date and time when this alarm was first generated.
Clear Time: Not applicable.
Email Sent: If this checkbox is selected, the email addresses where the alarm was sent will be displayed in the adjacent list.
Email Suppressed: If this checkbox is selected, the email addresses for which Alarm Email Suppression was active at the time of the alarm will be displayed in the adjacent list.
Alarm Text: The text in this box describes the problem that caused the alarm. If Email Sent is checked, this is the text that was sent in the email notification to the listed addresses.
If a note in red text appears at the top of this window, it indicates that the issue that caused the alarm occurred when the affected Location was unable to contact the Corente SCP. As soon as the Location was able to contact the Corente SCP, the alert was generated and displayed on the interface, and the email notification (if applicable) was sent. The date and time of the alert reflect the date and time when the Location was able to contact the Corente SCP.
When you select Cleared Alarms, all of the cleared alarms are listed in a table on the right side of the interface. This table displays:
Time Set: the date and time when the problem was detected and the alarm was first generated
Reference #: the unique reference number assigned to the alarm for identification purposes
Class: the category of alarm that was generated
Code: the code number corresponding to the type of alarm that was generated
Source: the Location or Client that generated this alarm
Time Cleared: the date and time when the problem was resolved and the alarm was cleared
You can click each of these headings to sort the alarms in the table by that heading.
When you open the Cleared Alarms branch, your cleared alarms will be sorted in the domain directory according to the Sort option that you have selected. Cleared alarms will be stored and displayed in the Cleared Alarms category for one month after the date the alarm was cleared.
To view detailed information about a Cleared Alarm that is listed on this interface:
Double-click the alarm in the table on the right side of the interface.
Double-click the alarm in the domain directory.
Right-click an alarm in the domain directory and select Edit.
Select an alarm in the domain directory and select Edit from the tool bar or the Edit menu.
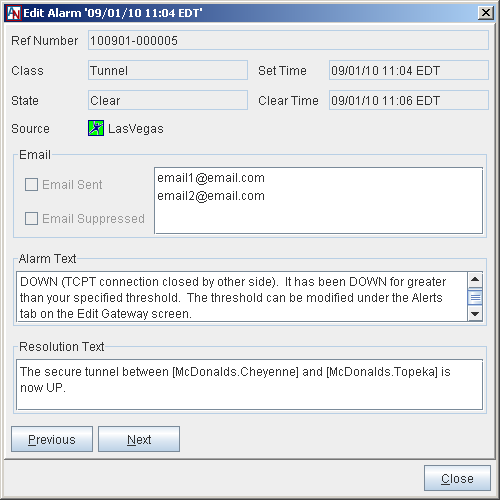
A window will be displayed that further explains this particular alarm:
Ref Number: The unique reference number assigned to this alarm for identification purposes.
Class: The category of alarm that was generated.
State: The entry in this field will be Clear, to denote that this is a cleared alarm.
Source: The Location or Client that generated this alarm.
Set Time: The date and time when this alarm was first generated.
Clear Time: The date and time when this alarm was cleared.
Email Sent: If this checkbox is selected, the email addresses where the alarm cleared notification was sent will be displayed in the adjacent list.
Email Suppressed: If this checkbox is selected, the email addresses for which Alarm Email Suppression was active at the time of the alarm will be displayed in the adjacent list.
Alarm Text: The text in this box describes what caused the alarm. If Email Sent is checked, this is the text that was sent in the email notification to the listed addresses.
Resolution Text: The text in this box describes what happened to clear the alarm. If Email Sent is checked, this is the text that was sent in the email notification to the listed addresses.
If a note in red text appears at the top of this window, it indicates that the issue that caused the alarm occurred when the affected Location was unable to contact the Corente SCP. As soon as the Location was able to contact the Corente SCP, the alert was generated and displayed on the interface, and the email notification (if applicable) was sent. The date and time of the alert reflect the date and time when the Location was able to contact the Corente SCP.
When you select Events, all of the event notifications are listed in a table on the right side of the interface. This table displays:
Time Set: the date and time when the event was detected
Reference #: the unique reference number assigned to the event for identification purposes
Class: the category of event that was generated
Code: the code number corresponding to the type of event that was generated
Source: the Location or Client that generated this event
Count: how many times the event has occurred
Last Occurred: the date and time of the last occurrence
You can click each of these headings to sort the events in the table by that heading.
When you open the Events branch, your events will be sorted in the domain directory according to the Sort option that you have selected. Events will be stored and displayed in the Events category for one week after they have been generated.
To view detailed information about an Event that is listed on this interface:
Double-click the event in the table on the right side of the interface.
Double-click the event in the domain directory.
Right-click an event in the domain directory and select Edit.
Select an event in the domain directory and select Edit from the tool bar or the Edit menu.
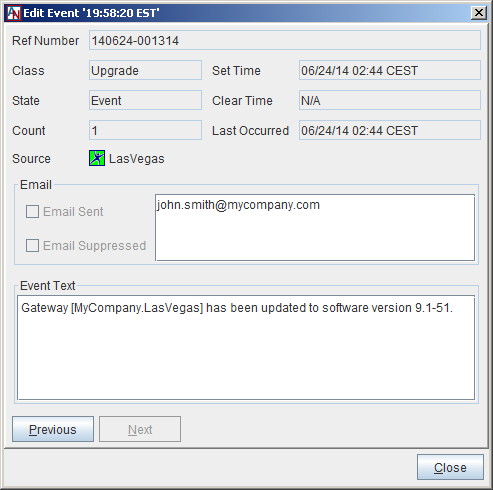
A window will be displayed that further explains this particular event:
Ref Number: The unique reference number assigned to this event for identification purposes.
Class: The category of event that was generated.
State: The entry in this field will be Event, to denote that this is an event.
Count: How many times the event has occurred.
Source: The Location or Client that generated this event.
Set Time: The date and time when this event was generated.
Clear Time: Not applicable.
Last Occurred: The date and time of the last occurrence.
Email Sent: If this checkbox is selected, the email addresses where the event notification was sent will be displayed in the adjacent list.
Email Suppressed: If this checkbox is selected, the email addresses for which Alarm Email Suppression was active at the time of the alarm will be displayed in the adjacent list.
Event Text: The text in the event that caused an event notification to be generated. If Email Sent is checked, this is the text that was sent in the email notification to the listed addresses.
If a note in red text appears at the top of this window, it indicates that the event that caused the alert occurred when the affected Location was unable to contact the Corente SCP. As soon as the Location was able to contact the Corente SCP, the alert was generated and displayed on the interface, and the email notification (if applicable) was sent. The date and time of the alert reflect the date and time when the Location was able to contact the Corente SCP.
Alarms are not loaded or refreshed automatically in App Net Manager. To view alarms on your map when you log into App Net Manager:
Right-click anywhere on the map but a Location icon.
Highlight Alarms.
Select Load Alarms.
Alarms data will be loaded onto your map so that you can see what Locations are
generating alerts. Locations that are generating alerts will display a yellow alarm image on
their icons (  ).
).
If you have already loaded alarms, are monitoring the status of an alarm in the domain, and would like to view the most up-to-date alarm data on the interface:
Right-click anywhere on the map but a Location icon.
Highlight Alarms.
Select Refresh Alarms.
The most up-to-date alarms data will be displayed on your map and in the domain directory.