
App Net Manager provides graphical and statistical reports for each Corente network. The Reports feature provides graphs that allow you to monitor the performance of your domain and logs that allow you to monitor various activities. Reports do not refresh automatically in App Net Manager; to view the most recent data in a report, you must right-click the report in the domain directory and select Refresh/Clear Changes.
Depending on the level of permissions that your administration account has been granted, you may or may not have access to the Reports feature in App Net Manager.
App Net Manager allows you to forward reports via email to the email address(es) that you specify. Graphs will be sent as image files and logs will be displayed in the email in a table format. Alarms will be sent in the same format as they are sent when emailed for email notification.
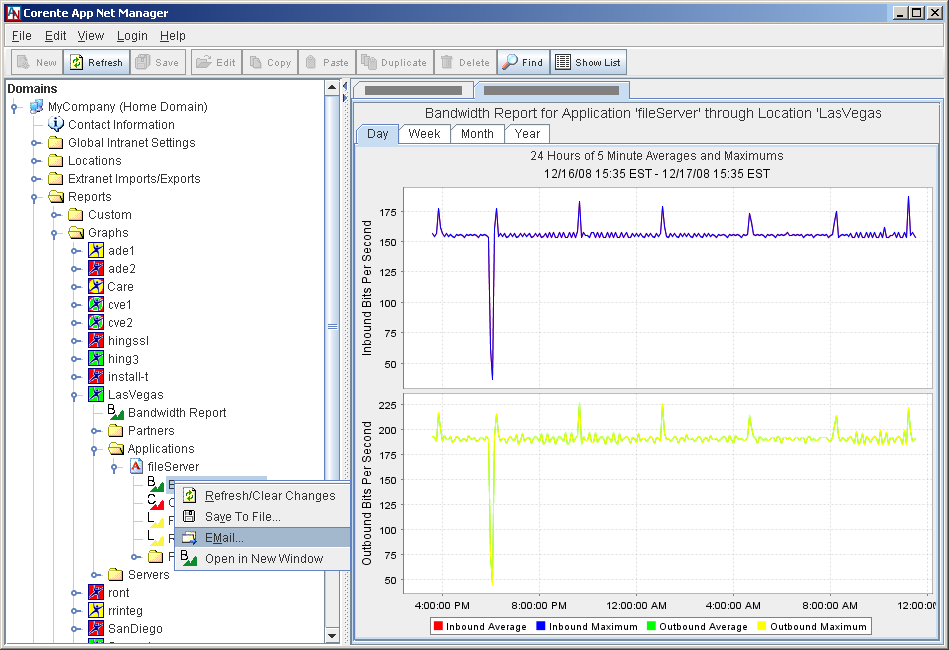
To email a report or alarm, right-click the report or alarm in the domain tree and select Email…
This will display the Select Recipients screen.
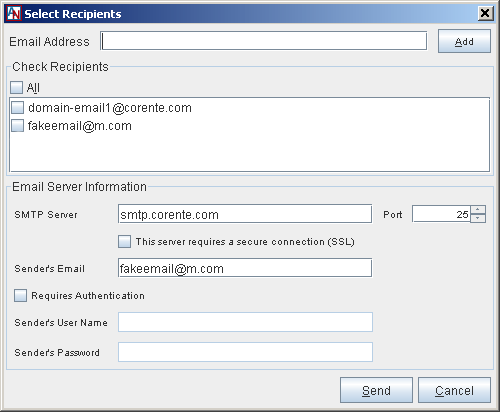
Fill out the screen as follows:
Check Recipients: Use this section to select the recipients of the report or alarm. This section will display the default email address(es) that you have saved in the Domain Preferences window for your domain. Select either the checkbox beside All (to send the report to all addresses within this list) or beside as many individual addresses as you would like.
To add a new address to this list, enter the fully-formed email address in the Email Address field above and select Add.
SMTP Server and Port: Enter the host name or IP address of the SMTP server that you use to send email in the SMTP Server field. Enter the port number used to contact this server in the Port field. If you have entered a default SMTP server and port number in the Domain Preferences window for your domain, that information will appear in these fields by default.
Sender’s Email: Enter your email address in this field.
Requires Authentication: Select this checkbox if your SMTP server requires you to log in to send email. When this checkbox is selected, fill in the following fields:
Sender's User Name: Enter the username required to log in to the SMTP server for your email address.
Sender's Password: Enter the password required to log in to the SMTP server for your email address.
Click Send to send the report.
You can store settings for your SMTP mail server in the App Net Manager Domain Preferences window. For more information, refer to Section 1.7, “Manage Your Corente Account and Domain”.
The Graphs category of Reports contains graphs per Location that detail certain statistics over time. When you open the Graphs category, a list of all Locations in your domain that have contacted the Corente SCP at least once will be displayed.
When you select a Location, all of the available graphs for that Location will be displayed in the table on the right side of the interface. This table displays:
Report Type: the type of graph
Location: the Location whose graphs you are viewing
Partner: the associated partner for this graph, if applicable
Application/Server:the associated application or server for this graph, if applicable
Last Update: the last time the graph was updated with new data (to update the graph, right-click Graphs or the specific graph in the domain directory and select Refresh/Clear Changes)
Time Loaded: the last time the graph was refreshed in App Net Manager
You can select one of these graphs from the table to open it, or
open a Location in the domain directory and select a graph from
the subcategories listed inside. You can open a graph in a new
window by right-clicking the report in the domain directory and
selecting Open in New Window from the menu
that appears. You can also save the report to file by
right-clicking the report and selecting Save to File and saving
the graph with a .txt extension (when saved
to file, the report will contain the data points for the past 24
hours and is formatted with comma separated fields).
All graphs are displayed on the right side of the interface and can be displayed in four different time measurements: the last day, the last week, the last month, and the last year. To select between these time measurements, use the tabs at the top of each graph. In addition, each graph can be controlled by options available by right-clicking the graph (including Zoom options, which allow you to view the graph in smaller time measurements than one day). The legend for the graph is always displayed at the bottom of the interface.
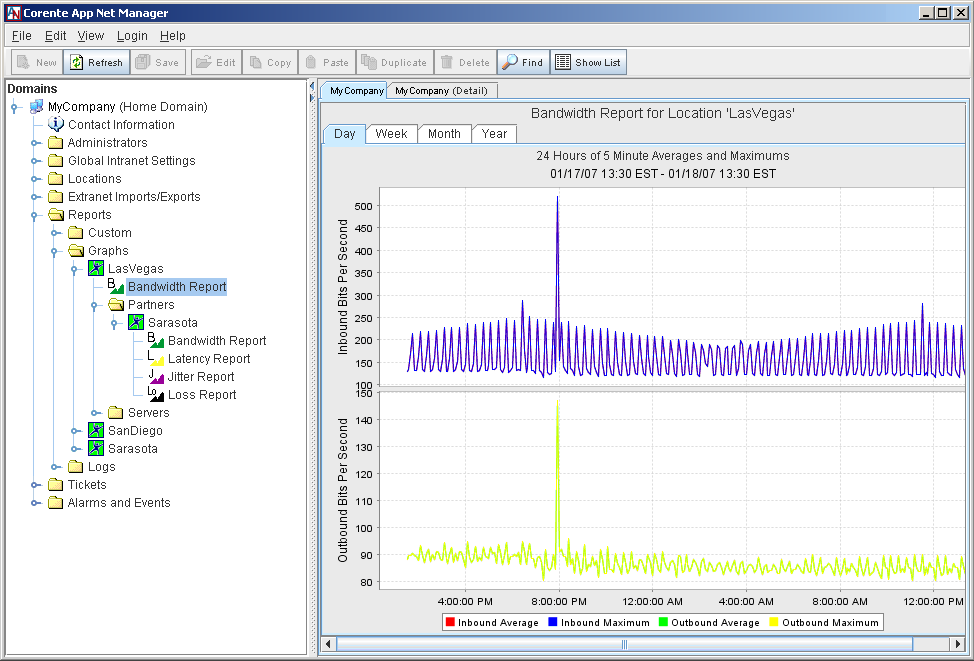
When you open a Location in the domain directory, the graph reports are organized according to the following categories (note that certain categories will be displayed only if the reports are applicable):
Bandwidth
Partners
Applications
Servers
Explanations of the graphs in these categories are as follows:
Bandwidth: This report displays two graphs: the inbound bandwidth and the outbound bandwidth through the Location, over time. These graphs allow you to monitor bandwidth usage for each of your Locations. Both graphs display the maximum and the average bandwidth for each direction of traffic.
Partners: When you open the Partners subcategory, all of the partners of this Location (that have contacted the Corente SCP at least once) are displayed. When you select a partner, the table on the right side of the interface will list only those reports that are available for this Location and the partner. You can also open the partner in the domain directory to show a list of available reports between the partners. Select a report on the table or in the domain directory to display the report on the right side of the interface. In addition to partners of this Location within your domain, these reports are available for partners of this Location that were imported into your domain with the Extranet feature (see Section 1.9, “Create an Extranet”.
Bandwidth: The Bandwidth report for partners allows you to monitor bandwidth usage, over time, between this Location and its partner. This report displays one graph: the outbound bandwidth to the partner from this Location, over time. The graph displays both the maximum and the average bandwidth for the outbound direction of traffic.
Latency: The Latency reports allow you to monitor the amount of latency of traffic over time as the traffic travels between this Location and its partner. If you have configured QoS priority levels for any traffic that travels between these Locations, the data will be split into measurements for each priority level that you have used (high, medium, and/or low). Select one of the following types of Latency reports from the tabs at the top of the graph:
The Minimum Latency report allows you to monitor the minimum amount of latency of traffic, over time, as the traffic travels between this Location and its partner.
The Maximum Latency report allows you to monitor the maximum amount of latency of traffic, over time, as the traffic travels between this Location and its partner.
The Average Latency report allows you to monitor the average latency of traffic, over time, as the traffic travels between this Location and its partner.
Jitter: The Jitter reports allow you to monitor the amount of jitter of traffic over time as the traffic travels between this Location and its partner. (Jitter is the difference between when a packet is expected to arrive and when it actually arrives.) If you have configured QoS priority levels for any traffic that travels between these Locations, the data will be split into measurements for each priority level that you have used (high, medium, and/or low).
The Minimum Jitter report allows you to monitor the minimum amount of jitter of traffic, over time, as the traffic travels between this Location and its partner.
The Maximum Jitter report allows you to monitor the maximum amount of jitter of traffic, over time, as the traffic travels between this Location and its partner.
The Average Jitter report allows you to monitor the average jitter of traffic, over time, as the traffic travels between this Location and its partner.
Loss: The Loss reports allow you to view graphs of the percentage of packets lost in traffic as the traffic travels between this Location and its partner. If you have configured QoS priority levels for any traffic that travels between these Locations, the data will be split into measurements for each priority level that you have used (high, medium, and/or low).
The Maximum Loss report allows you to monitor the maximum amount of packet loss, over time, as the traffic travels between this Location and its partner.
The Average Loss report allows you to monitor the average amount of packet loss, over time, as the traffic travels between this Location and its partner.
Applications: When you open the Applications subcategory, all of the applications that have been registered on this Location are displayed. When you select an application in the domain directory, the table on the right side of the interface will display only those reports that have been generated for that application. You can also open one of these applications in the domain directory to view the available reports. Select one of these reports from the table or the domain directory to display it on the right side of the interface:
Bandwidth: This report displays two graphs: the inbound bandwidth and the outbound bandwidth through the application, over time. These graphs allow you to monitor bandwidth usage for this application. Both graphs display the maximum and the average bandwidth usage for each direction of traffic.
If you have enabled test(s) for the application that return results within an elapsed time, report(s) will be available for the test(s). Application test reports will display maximum, minimum, and average latency measurements. The Network Quality and Roundtrip Latency tests will display average loss measurements in addition to the latency measurements. The File Share test will not generate reports since this test does not measure latency.
Open the Partners subcategory to display all of the partners that have been granted access this application in a tube definition. In addition to partners of the application's Location within your domain, these reports are available for partners of this application's Location that were imported into your domain with the Extranet feature. When you open a partner, categories are displayed that allow you to view partner-specific graphs for each of these categories:
Bandwidth: These graphs monitor maximum and average bandwidth usage, over time, for an application per set of Location partners. These graphs detail all traffic flowing between the Location and the partner for the application (both inbound traffic going to the application from the partner and outbound traffic leaving from the application to the partner).
NoteThe use of "local" in a partner name denotes that the Location's local LAN has been configured to use the application in a tube definition.
Servers: When you open the Servers subcategory, all of the servers that have been registered on this Location (as either an application server or a monitored server) are displayed. When you select a server in the domain directory, the table on the right side of the interface will display only those reports that have been generated for that server. You can also open one of these servers in the domain directory to view the available reports. Select one of these reports from the table or the domain directory to display it on the right side of the interface:
Resource: The Resource reports provide graphs that detail, over time, percent utilization of the resources of the selected server, both average and maximum measurements. Select the tabs along top of graph to show usage graphs for each of the following resources: CPU Usage, Disk Usage, Memory Usage, and Swap Usage. Depending on what has been configured for each server, some of these graphs may not be available. (These reports can be enabled when you register a server on the Monitored Servers tab of the Location form.)
Bandwidth: This graph allows you to monitor bandwidth usage, over time, for an application server. These graphs detail the maximum and average bandwidth flowing through the Location server for that server (both inbound traffic going to the LAN and outbound traffic leaving from the LAN). (This report is enabled when you register an application, specify a server for this application, and select Monitoring Enabled on the Applications tab of the Location form.)
Open the Partners subcategory to display all of the partners that have been granted access this application server in a tube definition. In addition to partners of the application server's Location within your domain, these reports are available for partners of this application server's Location that were imported into your domain with the Extranet feature. When you open a partner, report categories are displayed that allow you to view partner-specific graphs for each of these reports:
Bandwidth: These graphs allow you to monitor average and maximum bandwidth usage, over time, for an application server per set of Location partners. You can view graphs that detail all traffic flowing between those partners for the application server (both inbound traffic going to the server from the partner and oubound traffic leaving from the server to the partner). Note that the use of "local" in a partner name denotes that the Location's local LAN has been configured to use one or more application(s) on the server in a tube definition.
When you right-click a graph, a menu is displayed that provides certain controls over how the graph is displayed in App Net Manager.
Properties: Select this option to display a tabbed dialog box that allows you to control how the appearance of the graphs.
Copy: Select this option to copy the current graph for pasting into another application.
Save as: Select this option to save a capture of the current graph as a png file on your system.
Print: Select this option to print a capture of the current graph.
Zoom In: Highlight this option to zoom in on either the horizontal axes, the vertical axes, or both axes at once. This option allows you to view more detail in the graph.
Zoom Out: Highlight this option to zoom out on either the horizontal axes, the vertical axes, or both axes at once. This option allows you to view a more summarized graph.
Auto Range: Highlight this option to return to the default zoom on either the horizontal axes, the vertical axes, or both axes at once.
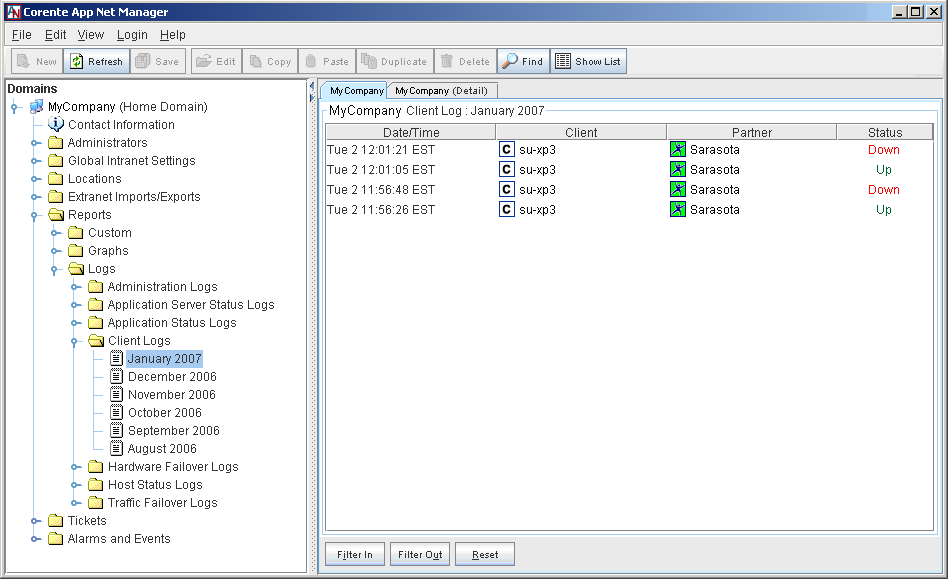
The Logs category of Reports contains monthly activity logs for the following categories of activity:
Administration Logs
Application Server Status Logs
Application Status Logs
Client Logs
Hardware Failover Logs
Host Status Logs
Traffic Failover Logs
Select or open a category in the domain directory to view the available monthly logs for that category. Logs for up to twelve months may be available. To view a log, select the month in either the domain directory or on the table on the right side of the interface. The log will be displayed as a table on the right side of the interface.
You can also save a log to file by right-clicking the report,
selecting Save to File, and saving the log with a
.txt extension (when saved to file, the
report will be formatted with comma separated fields).
The Administration Logs allow you to view monthly summaries of the activity of administrators in your domain. Each monthly log displays:
Date/Time: the date/time when the action occurred
Administrator: the user account who performed the Action
Action: the action that was taken by the Administrator
Category: the category of Object that was changed
Object: the specific item in the domain that was changed (there may be two objects if the change occurred between them)
Source: where the action originated from, if applicable
User Host Name (IP): the location from where App Net Manager was accessed
To sort the log by any of these headings, simply click on a heading.
The types of users who may be listed on these logs are Super User (the administrator username that you created during registration), SCP Operator (if your application network was modified by your Corente SCP operator), External (an administrator from another application network to whom you granted application network access permissions), and End User (if a user downloads the Corente Client Software). In addition, if you have created additional administrator accounts for App Net Manager, each activity by these accounts will be listed by username.
The Application Server Status Logs allow you to view monthly logs of the status of each application server that is registered to a Location within your domain. Each monthly log displays:
Date/Time: the date/time when the status of the server changed
Location: the Location on which the application server was registered, using the Applications tab of the Location form
Monitored Server: the host name that you entered for the server of an application on the Applications tab
IP Address: the IP address that you entered for the server of an application on the Applications tab
Status: the status of the server. The possible statuses are:
Table 1.4 Application Server Status
Status
Description
Up
The server is currently active and can be used.
Down
The server is currently unavailable.
Unknown
This status may denote any of the following states: the application(s) on the server are down, the server is down, and/or there is no connectivity to the application(s) or server.
Warning
If a server provides multiple applications that use different protocols, this status indicates that the test(s) for some of the protocol(s) are failing while others are succeeding or one or more application(s) on the server have exceeded their warning threshold, as defined on the Applications tab, and are generating a warning alarm.
Critical
One or more application(s) on the server have exceeded their critical threshold, as defined on the Applications tab, and are generating a critical alarm.
N/A
Test(s) used to determine the status of application(s) on this server have not been configured on the Applications tab. Therefore, the status cannot be identified.
To sort the log by any of these headings, simply click on a heading.
The Application Status Logs allow you to view monthly logs of status changes of the applications registered in your domain. Each monthly log displays:
Date/Time: the date/time when the status of the application changed
Location: the Location on which the application was registered, using the Applications tab of the Location form
Application: the name that you entered for the application on the Applications tab
Type: whether this is an application used inside the application network (application) or outside the application network (service)
IP Address: the IP address that you entered for the application's server on the Applications tab
Service: the protocol associated with the application that changed status
Port: the port number associated use by the Service
Display Name: the test that detected a change in status for the application
Status: the status of the application. The possible statuses are:
Table 1.5 Application Status
Status
Description
Up
The application is currently active and can be used.
Down
The application is currently unavailable.
Unknown
This status may denote any of the following states: the application is down, the server is down, and/or there is no connectivity to the application or server.
Warning
If an application uses multiple protocols (for example, an email application would use both the POP protocol and the SMTP protocol), this status indicates that the test(s) for some of the protocol(s) are failing while others are succeeding or the application has exceeded its warning threshold, as defined on the Applications tab, and is generating a warning alarm.
Critical
The application has exceeded its critical threshold, as defined on the Applications tab, and is generating a critical alarm.
N/A
A test used to determine the status of the application has not been configured on the Applications tab. Therefore, the status cannot be identified.
To sort the log by any of these headings, simply click on a heading.
The Client log allows you to view logs of the activity by each Corente Client that has connected to a Location in your domain. Each monthly log displays:
Date/Time: the date/time when the Status of the Client changed
Client: the Client account
Partner: the Location partner to whom the Client is/was connected
Status: the status of the connection (the possible statuses are Up, Down, and Alert)
To sort the log by any of these headings, simply click on a heading.
The Hardware Failover log allows you to view the date and times at which a hardware failover occurred for any of the Locations in your domain that have Redundant Hardware Configuration enabled (on the Location tab of the Location form – for more about this feature, refer to the Corente Services Policy Definition and Provisioning manual ). Each monthly log displays:
Date/Time: the date/time when the hardware failover occurred (that caused the Active and Standby Location servers to rotate their statuses)
Location: the Location whose hardware failed over
Scheduled: whether or not the failover was a scheduled switch (either during a software upgrade or during the Weekly Maintenance window, if this option has been selected on the Location tab for the Location) (yes) or if the failover occurred because of a failure of the Active Location (no).
Status: whether the Location is connected to the Corente SCP (Up) or not (Down)
To sort the log by any of these headings, simply click on a heading.
The Host Status log allows you to view monthly logs of status changes for each monitored server that is registered in your application network. Each monthly log displays:
Date/Time: the date/time when the status of the server changed
Location: the Location on which the monitored server was registered, using the Monitored Servers tab of the Location form
Monitored Server: the name that you entered for the monitored server on the Monitored Servers tab
Type: this field will always list host
IP Address: the IP address of the monitored server that you entered on the Monitored Servers tab
Service: the resource being monitored whose status changed (CPU Usage, Disk Usage, Memory Usage, or Swap Usage)
Status: the status of the server. The possible statuses are:
Table 1.6 Host Status
Status
Description
Up
The server is currently active and can be used.
Down
The server is currently unavailable.
Unknown
This status may denote any of the following states: the server is down and/or there is no connectivity to the server.
Warning
If multiple resources are being monitored on the server, this status indicates that the test(s) for some of the resource(s) are failing while others are succeeding or this status indicates that the Service has exceeded its warning threshold, as defined on the Monitored Servers tab, and is generating a warning alarm.
Critical
This status indicates that the Service being monitored on the server has exceeded its critical threshold, as defined on the Monitored Servers tab, and is generating a critical alarm.
N/A
A test used to determine the status of the server's resource(s) has not been configured on the Monitored Servers tab. Therefore, the status cannot be identified.
To sort the log by any of these headings, simply click on a heading.
The Traffic Failover log allows you to view a history of User Group failovers that have occurred in your application network. (More information about traffic failover can be found in the section about the High Availability tab of the Location form in the Corente Services Policy Definition and Provisioning manual .) Each monthly log displays:
Date/Time: the date/time when the traffic failover occurred
Location: the Primary Location involved in the failover
Partner: the partner of the Primary Location that had to fail over or fail back to the Backup Location
Failover Location: the Backup Location involved in the failover
Description: whether the event was a take over or a fail back
To sort the log by any of these headings, simply click on a heading.
In addition to the Graphs and Logs categories of Reports, an additional Custom category of reports may be available for your domain. These reports have been enabled for you specifically by your Corente SCP operator. The following custom reports may be available:
All Clients in Domain
All Location Routes in Domain
All Location to Location Tubes in Domain
All Location User Groups in Domain
All Locations in Domain
Client Partnership Detail
Location SSL Information
You can save a custom report to file by right-clicking the
report, selecting Save to File, and saving the report with a
.txt extension (when saved to file, the
report will be formatted with comma separated fields). You may
also choose to email a custom report to an address of your
choice.
This report displays all of the Corente Client and Corente SSL Client accounts that have been created in the domain. This report lists:
Client: The name of the Corente Client or SSL Client. The icon beside the client name indicates what type of client it is.
Version: If this is a Corente Client, the version of the software that the Corente Client is running. If this is an SSL Client, this field will display SSL Client.
Created: When this client account was first created.
First Contact: If this is a Corente Client, the first time that the Corente Client contacted the Corente SCP. If this is an SSL Client, this field will display Not Set.
Last Contact: If this is a Corente Client, the most recent time that the Corente Client contacted the Corente SCP. If this is an SSL Client, this field will display Not Set.
Routes are used to allow multiple subnets in a local network to participate in the Corente application network. This report displays all routes that have been configured between local subnets and Location gateways within the Domain. This report lists:
Location: The Location on which a given route was created. The icon beside the Location name indicates the current status of this Location.
Primary and Secondary WAN Address: The IP address and subnet mask of the Location's primary and (if present) secondary WAN interface.
Primary and Secondary WAN Gateway: The IP address of the gateway associated respectively with the primary and (if present) secondary WAN interface.
Primary and Secondary DNS: IP address of the primary and secondary DNS server. A primary and secondary DNS server may be configured for both the primary and secondary WAN interface of a Location.
LAN Address: The IP address and subnet mask of the Location’s LAN interface.
Route: The IP range and subnet mask of the subnet for which a given route was configured.
Route Gateway: The IP address of the gateway that provides external network connectivity from within a given subnet.
For more information on routes, refer to the section entitled “Routes” in the Corente Services Policy Definition and Provisioning manual.
This report displays all of the Location to Location tubes that have been created in the domain. This includes tubes created between Locations in the domain, and tubes created between Locations in the domain and Locations imported from other domains through extranets (however, with extranet partnerships, only the tubes that were created on the local side will be displayed in this report). For more information about tubes, refer to the Corente Services Policy Definition and Provisioning manual.
This report lists:
Location: The Location on which this tube was created. The icon beside the Location name indicates the current status of this Location.
Partner: The partner of the Location to which this tube was created. The icon beside the partner name indicates the current status of this partner, as well as whetherit is a local or imported Location.
User Group/Application: The name of the User Group or application of the Location that is involved in this tube (i.e., the Local User Group/Application).
Partner User Group/Application: The name of the User Group or application of the Partner that is involved in this tube (i.e., the Remote User Group/Application).
Firewall Policy: If a Firewall Policy was assigned between the Location's User Group/Application and the Partner's User Group/Application, this Firewall Policy will be displayed in this field.
Application: Whether or not the User Group/Application entry for this tube is an application.
Partner Application: Whether or not the Partner User Group/Application entry for this tube is an application.
Outbound QoS: If a Quality of Service (QoS) entry was assigned to outbound traffic in this tube, this field will display the entry that was assigned.
Inbound QoS: If a QoS entry was assigned to inbound traffic in this tube, this field will display the entry that was assigned.
This report displays all of the User Groups and applications that have been created/registered on Locations in the domain. This report displays:
Location: The Location on which this User Group was created/application was registered. The icon beside the Location name indicates the current status of this Location.
User Group/Application: The name of the User Group or application.
Config: The configuration of the Location (Peer or Inline).
Application: Whether or not the User Group/Application entry is an application.
Type: If this entry is a User Group, the type of User Group that was created (i.e., whether the group defined a range of addresses Included in the User Group, or if the group defined a range of addresses Excluded from the Default User Group to create this User Group). If this entry is an application, this field will display App.
Start Address: If this entry is a User Group, this field will display the first address of the address range in the User Group.
End Address: If this entry is a User Group, this field will display the last address of the address range in the User Group.
Outbound NAT: The Outbound NAT option assigned to this User Group/Application. Possible entries are Permitted, Prohibited, or Specified. If this entry is an application, this field will always display Permitted.
Firewall Policy: If a Firewall Policy was assigned to this User Group/Application, this Firewall Policy will be displayed in this field.
Outbound QoS: If a Quality of Service (QoS) entry was assigned to outbound traffic for this User Group/Application, this field will display the entry that was assigned.
Inbound QoS: If a QoS entry was assigned to inbound traffic for this User Group/Application, this field will display the entry that was assigned.
This report displays all of the Locations that have been created in the domain. This report lists:
Location: The name of the Location. The icon beside the Location name indicates the current status of this Location.
Version: The version of the Location software that it is running.
State: The current state of the software. See Table 1.7 for details.
Target Version: The target software version that has been set for the Location by the Corente SCP Operator.
Maintenance Time: The date and time that was selected for the Preferred Maintenance Time of this Location.
Clone Version: The version of the Location software on the other partition of the Location server's hard disk.
Clone State: The current state of the software on the other partition of the Location server's hard disk. See Table 1.7 for details.
Status: The current status of this Location. Possible statuses include Download, Downloaded, Active,Inactive, Alert, and Denied.
Config: The configuration of this Location (i.e., Inline or Peer).
Created: The date the Location was created in App Net Manager.
Last Contact: The most recent time when the Location contacted the Corente SCP.
The possible States and Clone States are as follows:
Table 1.7 Software State and Clone State
State | Description |
|---|---|
INITIAL | This is the first time Location software has run on this machine. |
UNKNOWN | The state of this software is unknown and should not be switched to. This is typically the result of a failed upgrade. |
STAGING | The partition is in the process of staging an upgrade to a new version of the software and should not be switched to. |
STAGED | A new version of the software has finished STAGING and is ready to be ARMED. |
ARMED | The partition is set as ready to run on the next reboot. |
BOOTING UP |
A new release is running for the first time, but has
not yet created a tunnel to the
Corente Services Control Point (SCP). If failure occurs in this
state, the active software will automatically switch
to what is stored on the |
WORKS | The release works (or has worked at least once - enough to create a secure tunnel to the Corente SCP). |
FAILED |
If a new release fails to contact the
Corente SCP after a specified amount of
time, the release is marked FAILED and an automatic
return to the |
This report provides detailed information about the partnerships between Clients and Locations within your domain. This report lists:
Client: The name of Corente Client or SSL Client that has a partnership with one of the Locations within the Domain. The icon beside the client name indicates what type of client it is.
Type: The type of client – RAS or SSL.
Client Group: The client group of which the client is a member.
Location: The Location with which the client has established a partnership.
User Group/Application: The user group or application in which the client participates.
This report displays the Corente SSL Client configuration of all Locations in the domain. This report lists:
Location: The name of the Location. The icon beside the Location name indicates the current status of this Location.
Port: The port number on the Location server that remote computers use to access the SSL Client. The default port is 443 for the SSL Client. If the port number is not 443, SSL Client users must connect directly to that port number. (For example, if the Visible DNS Name of Location is sslclient.example.com and the SSL Port is 999, to use the SSL Client for this Location, users would type https://sslclient.example.com:999). This port number must also be opened in any firewalls shielding this Location.
Visible DNS Name: The DNS name that SSL Client users use to connect to this Location from the WAN. Users enter
https://and this name in the location bar of their web browser. (If this DNS name is not resolvable via a public DNS server, this name should be added to the DNS server at each remote user's location or added as an entry to the hosts file of each user's computer.)SSL Enabled: Whether or not access to the SSL Client is enabled on this Location.