- 2.3.1 User Interface
- 2.3.2 Administrator Interface
- 2.3.3 Application Status on Network
- 2.3.4 Detailed Information on Application
- 2.3.5 Statistics History on Application
- 2.3.6 Detailed Information on Server
- 2.3.7 Statistics History on Server
- 2.3.8 Active Connections to Application
- 2.3.9 Statistics History on Application (Client Statistics)
- 2.3.10 Active Connections to Server
- 2.3.11 Statistics History on Server (Client Statistics)
- 2.3.12 Detailed Status on Application/Service
- 2.3.13 Detailed Status on Server
- 2.3.14 Status History on Server
- 2.3.15 Update Comment
Depending on whether or not you have subscribed to application and/or server monitoring, the Monitoring interface allows you to view statistics and graphs about applications and servers within your Corente network.
Server monitoring allows local administrators to monitor local servers. Simply register the server(s) with the local Corente Virtual Services Gateway in App Net Manager, and you can view usage statistics about each server concerning CPU, disk space, physical memory, and/or swap space.
Application monitoring allows your company to deploy applications easily between sites within your Corente network. Simply register the application with the local Corente Virtual Services Gateway in App Net Manager, and you can share the application securely (like an User Group) with any other Corente location(s) within your intranet or extranet. Corente application monitoring was designed with the following principles in mind: to confirm to both users and administrators that the applications are functioning correctly; to facilitate communication between both parties when they are not; to provide reports to help with capacity planning; and to provide diagnostic capabilities to locate bad actors within the network.
Top Talkers allows you to monitornetwork activity between machines on the local network and machines at remote sites and/or the Internet, to identify what machine pairs are using up the most bandwidth (i.e., the "top talkers").
The features that are available on the Monitoring screen(s) depend on whether or not you have logged in to Gateway Viewer via the Admin Login.
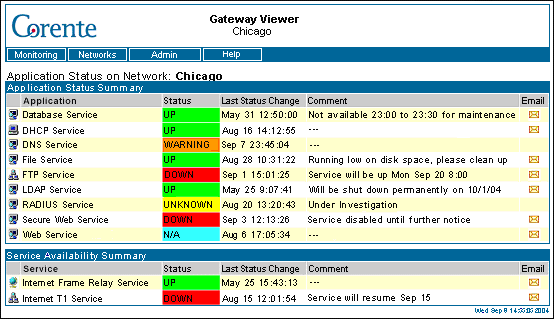
The User Interface of Monitoring will be displayed if you have subscribed to application monitoring and if you have not logged into Gateway Viewer via the Admin Login button. This is the default page of the Gateway Viewer application.
This interface allows users to view the status of each application that is available on local and remote networks, and to communicate with the specific administrator of each application via email. Depending on the permissions that the user's IP address has been granted via tubes in App Net Manager, applications that appear on this page may not be accessible. If unsure, users should contact their administrators to determine what applications they have been permitted to access.
The tables on this interface can be sorted via any category simply by selecting that category's heading. The category that is currently used for sorting will be displayed in bold characters. By default, the tables will be sorted alphabetically by the Application and Service categories.
The information on this interface will refresh automatically every 5 minutes. You can manually refresh the interface at any time by right-clicking your mouse and selecting Refresh from the menu that appears.
The Application Status Summary table displays information about applications that you can access on local or remote networks via your company's Corente network:
Application: This field displays the name or type of application.
Status: This field displays the current status of the application. Possible statuses include:
Table 2.1 Application Status
Status
Description
Up
The application is currently active and can be used.
Down
The application is currently unavailable.
Unknown
This status may denote any of the following states: the application is down, the server is down, and/or there is no connectivity to the application or server.
Warning
If an application uses multiple protocols (for example, an email application would use both the POP protocol and the SMTP protocol), this status indicates that the test(s) for some of the protocol(s) are failing while others are succeeding or the application has exceeded its warning threshold as defined by an administrator.
Critical
This status indicates that the application has exceeded its critical threshold as defined by an administrator.
N/A
A test used to determine the status of the application has not been configured in App Net Manager. Therefore, the status cannot be identified.
Last Status Change: This field displays the date and time that the application changed to its current status.
Comment: This field displays a short note written by the application's administrator.
Email: If it has been configured, an envelope icon will appear in this column that you can click to send an email message to the administrator of the application. This email link allows you to get in touch with the appropriate administrator for each application.
The Service Availability Summary table displays information about applications or services that are available to you and other local users.
Service: This field displays the name or type of the service.
Status: This field displays the current status of the service. Possible statuses include:
Table 2.2 Service Status
Status
Description
Up
The service is currently active and can be used.
Down
The service is currently unavailable.
Unknown
This status may denote any of the following states: the service is down, the server is down, and/or there is no connectivity to the service or server.
Warning
If a service uses multiple protocols (for example, an email application would use both the POP protocol and the SMTP protocol), this status indicates that the test(s) for some of the protocol(s) are failing while others are succeeding or the service has exceeded its warning threshold as defined by an administrator.
Critical
This status indicates that the service has exceeded its critical threshold as defined by an administrator.
N/A
A test used to determine the status of the service has not been configured in App Net Manager. Therefore, the status cannot be identified.
Last Status Change: This field displays the date and time that the service changed to its current status.
Comment: This field displays a short note written by the service's administrator.
Email: If it has been configured, an envelope icon will appear in this column that you can click to send an email message to the administrator of the application. This email link allows you to get in touch with the appropriate administrator.
The Administrator Interface of Monitoring will be displayed if you have logged into Gateway Viewer via the Admin Login button.
This interface provides network administrators with tools for analysis and problem drill down concerning the network and the applications and/or servers running on the network. It is more complex than the user interface and contains multiple screens:
Application Status on Network
Server Status on Network
Detailed Information on Application
Statistics History on Application
Detailed Information on Server
Statistics History on Server
Active Connections to Application
Statistics History on Application (Client Statistics)
Active Connections to Server
Statistics History on Server (Client Statistics)
Detailed Status on Application/Service
Detailed Status on Server
Detailed Status on Server History
Update Comment
You can set the refresh rate for the Administrator Interface by clicking the refresh icon that is displayed at the top of each page. Enter a value in the dialog box that appears. You can enter a value between 5 seconds and 3600 seconds (1 hour). This value is persistent and will be used for all Administrator Interface pages. The default refresh rate is 300 seconds (5 minutes). To manually refresh a page at any time, click the right mouse button within the frame that you would like to refresh and select the Refresh option from the menu that appears.
In general, do not use the Back button on your browser to navigate through the application monitoring interface. This may cause cached information to be displayed. To ensure that you are viewing the most up-to-date data, use only the hyperlinks provided on the interface to load pages.
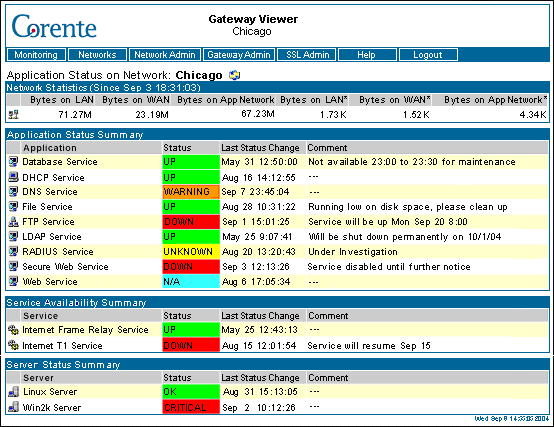
The Application Status on Network page provides a summary of the local applications, services, and/or servers that are registered on the local Location gateway for monitoring and/or sharing with other Corente network locations. Selecting certain items on this page will display detailed information about those items.
The tables on this interface can be sorted via any category simply by selecting that category's heading. The category that is currently used for sorting will be displayed in bold characters.
The Network Statistics table provides a summary of the traffic traveling to and through the local Corente Virtual Services Gateway. If the number of bytes recorded in any category exceeds 1024, the number of bytes will be rounded off and listed in K(ilobytes), M(egabytes), G(igabytes), etc.
Bytes on LAN: The total number of bytes, measured by the Location gateway, that have been sent on the LAN since the last time the Location gateway was started (i.e., the date/time in the Network Statistics section heading).
Bytes on WAN: The total number of bytes, measured by the Location gateway, that have been sent on the WAN since the last time the Location gateway was started (i.e., the date/time in the Network Statistics section heading). WAN traffic includes both Internet traffic and alternate connection traffic (i.e., non-Corente-network-site-to-site traffic).
Bytes on App Network: The total number of bytes, measured by the Location gateway, that have been sent on the Corente network since the last time the Location gateway was started (i.e., the date/time in the Network Statistics section heading).
Bytes on LAN*: The total number of bytes, measured by the Location gateway, that have been sent on the LAN in the last 5-second interval. This 5-second interval is the 5 seconds preceding the last date and time the page was refreshed (i.e., the date and time displayed in the heading of this table).
Bytes on WAN*: The total number of bytes, measured by the Location gateway, that have been sent on the WAN in the last 5-second interval. WAN traffic includes both Internet traffic and alternate connection traffic (i.e., non-Corente-network-site-to-site traffic).
Bytes on App Network*: The total number of bytes, measured by the Location gateway, that have been sent on the Corente network in the last 5-second interval.
The Application Status Summary table displays a summary of information about each application that has been registered with the local Corente Virtual Services Gateway for use over the Corente network.
Application: This field dispays the name or type of application. Click the entry in this field to display the Detailed Information on Application page about this application.
Status: This field displays the last reported status of the application. Click the entry in this field to display the Detailed Status on Application page about this application's status. Possible entries in the field are:
Table 2.3 Application Status
Status
Description
Up
The application is currently active and can be used.
Down
The application is currently unavailable.
Unknown
This status may denote any of the following states: the application is down, the server is down, and/or there is no connectivity to the application or server.
Warning
If an application uses multiple protocols (for example, an email application would use both the POP protocol and the SMTP protocol), this status indicates that the test(s) for some of the protocol(s) are failing while others are succeeding or the application has exceeded its warning threshold, as defined in App Net Manager, and is generating a warning alarm.
Critical
This status indicates that the application has exceeded its critical threshold, as defined in App Net Manager, and is generating a critical alarm.
N/A
A test used to determine the status of the application has not been configured in App Net Manager. Therefore, the status cannot be identified.
Last Status Change: This field displays the time that the application changed to its current status.
Comment: This field displays a short note about the application or its status that is displayed to users. Click the entry in this field to use the Update Comment page to add a comment, delete the current comment, or change the current comment. This comment will be displayed on both the User Interface and the Administrator Interface.
The Service Availability Summary table displays a summary of information about applications and services that are only available for use by local users. These may be applications or services on the local network, on the Internet, etc., but they are not shared over the Corente network.
Service: This field displays the name or type of service.
Status: This field displays the last reported status of the service. Click the entry in this field to display the Detailed Status on Service page about this service's status. Possible entries in the field are:
Table 2.4 Service Status
Status
Description
Up
The service is currently active and can be used.
Down
The service is currently unavailable.
Unknown
This status may denote any of the following states: the service is down, the server is down, and/or there is no connectivity to the service or server.
Warning
If a service uses multiple protocols (for example, an email application would use both the POP protocol and the SMTP protocol), this status indicates that the test(s) for some of the protocol(s) are failing while others are succeeding or the service has exceeded its warning threshold, as defined in App Net Manager, and is generating a warning alarm.
Critical
This status indicates that the service has exceeded its critical threshold, as defined in App Net Manager, and is generating a critical alarm.
N/A
A test used to determine the status of the service has not been configured in App Net Manager. Therefore, the status cannot be identified.
Last Status Change: This field displays the time that the service changed to its current status.
Comment: This field displays a short note about this service or its status. Click the entry in this field to use the Update Comment page to add a comment, delete the current comment, or change the current comment. This comment will be displayed on both the User Interface and the Administrator Interface.
The Server Status Summary table displays a summary of information about local servers that have been registered with the local Location gateway.
Server: This field displays the name or type of the server.
Status: This field displays the last reported status of the server. Click the entry in this field to display the Detailed Status on Server page about this server's status (see). Possible entries in the field are:
Table 2.5 Server Status
Status
Description
Up
The server is currently active and can be used.
Down
The server is currently unavailable.
Unknown
This status may denote either of the following states: the server is down and/or there is no connectivity to the server.
Warning
If multiple resources are being monitored on the server (for example, the following resources can all be monitored: CPU Load, Disk Space Usage, Memory Usage, and Swap Space Usage), this status indicates that the test(s) for some of the resource(s) are failing while others are succeeding or this status indicates that one or more of the resources have exceeded their warning thresholds, as defined in App Net Manager, and are generating a warning alarm.
Critical
This status indicates that one or more of the resources being monitored on the server have exceeded their critical thresholds, as defined in App Net Manager, and are generating a critical alarm.
N/A
A test used to determine the status of the server has not been configured in App Net Manager. Therefore, the status cannot be identified.
Last Status Change: This field displays the time that the server changed to its current status.
Comment: Because server monitoring data is viewable only by administrators, the comment field is unavailable.
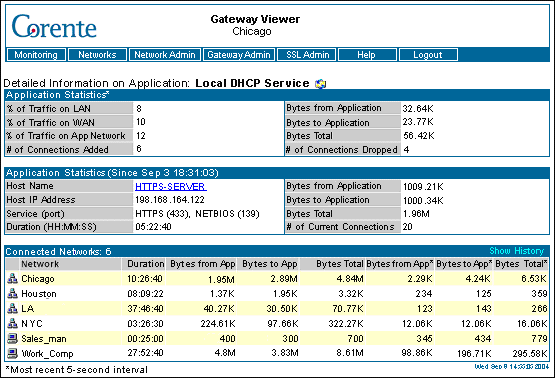
The Detailed Information on Application page displays statistics and connection information about the application that you have selected.
The Application Statistics table displays statistics from the last 5-second interval. This 5-second interval is the 5 seconds preceding the date and time that the page was last refreshed (i.e., the date and time displayed at the bottom of the page). If the number of bytes recorded in a category on this table exceeds 1024, the number of bytes will be rounded off and listed in K(ilobytes), M(egabytes), G(igabytes), etc.
% of Traffic on LAN: The percent of the total traffic on the LAN during the 5-second interval that consisted of traffic to and from this application.
% of Traffic on WAN: The percent of the total traffic on the WAN during the 5-second interval that consisted of traffic to and from this application. WAN traffic includes both Internet traffic and alternate connection traffic (i.e., non-Corente-network site-to-site traffic).
% of Traffic on App Network: The percent of the total traffic on the Corente network during the 5-second interval that consisted of traffic to and from this application.
Bytes from Application: The total number of bytes sent from the application to machines with active connections during the 5-second interval.
Bytes to Application: The total number of bytes sent to the application from machines with active connections during the 5-second interval.
Bytes Total: The total number of bytes both sent and received by this application during the 5-second interval.
# of Connections Added: The number of connections that were added during the 5-second interval.
# of Connections Dropped: The number of connections that were dropped during the 5-second interval.
The Application Statistics table displays host information, protocol, and traffic information about the selected application. If the number of bytes recorded in a category on this table exceeds 1024, the number of bytes will be rounded off and listed in K(ilobytes), M(egabytes), G(igabytes), etc.
Host Name: The name of server providing this application. Select the entry in this field to show the Detailed Information on Server page for this server.
Host IP Address: The IP address of the server that is providing this application.
Service (Port): The type of service/protocol and the corresponding port number that machines must use to make connections to this application. This field may contain multiple entries.
Duration (HH:MM:SS): The amount of time between the date/time displayed in the heading of this section and the date/time displayed at the bottom of the page. The statistics within this section have all been collected during this duration.
Bytes from Application: The total number of bytes sent from the application to machines with active connections since the last time the Location gateway was last started (i.e., the date/time displayed in the heading of this section).
Bytes to Application: The total number of bytes sent to the application from machines with active connections since the last time the Location gateway was last started (i.e., the date/time displayed in the heading of this section).
Bytes Total: The total number of bytes both sent and received by this application since the last time the Location gateway was last started (i.e., the date/time displayed in the heading of this section).
# of Current Connections: The total number of current connections that are established to this application.
The Connected Networks table lists all of the networks with machines that are currently connected to this application. The total number of current connected networks is displayed in the title of the section. Click the Show History hyperlink to display the Statistics History on Application page and view historical graphs of all active network connections to this application. If there are more than ten connected networks, an additional hyperlink will be displayed: click the Top Ten hyperlink to view historical graphs of only the top 10 network bandwidth users (based on the total number of bytes sent and received by the application to/from each network). If the number of bytes recorded in a category on this table exceeds 1024, the number of bytes will be rounded off and listed in K(ilobytes), M(egabytes), G(igabytes), etc.
Network: The name of the Corente Virtual Services Gateway whose network has active connections with this application. If the Location gateway is within another Corente domain and has an extranet connection with the local Location gateway, this entry will contain the Location gateway's full name (i.e.,
domainname.gatewayname). Select an entry in this column to view the Active Connections (by client IP address) on this network to the application.NoteThe icon to the right of each entry in this column indicates whether the entry is a network (
 ) or a Remote Corente Client (
  ). If this entry is a Corente Client, when the entry
is selected, the Active Connections page will display the statistics for a single
computer (i.e., the Corente Client itself).
 Duration (HH:MM:SS): The total duration of this network or Corente Client's connection to the application.
Bytes from App: The total number of bytes sent from the application to machines on this network or to this Corente Client since the last time the Location gateway was started (i.e., the date/time displayed in the heading of the Application Statistics section).
Bytes to App: The total number of bytes sent to the application from machines on this network or from this Corente Client since the last time the Location gateway was started (i.e., the date/time displayed in the heading of the Application Statistics section).
Bytes Total: The total number of bytes both sent and received by the application to and from machines on this network or this Corente Client since the last time the Location gateway was started (i.e., the date/time displayed in the heading of the Application Statistics section).
Bytes from App*: The total number of bytes sent from the application to machines on this network or to this Corente Client during the 5-second interval.
Bytes to App*: The total number of bytes sent to the application from machines on this network or from this Corente Client during the 5-second interval.
Bytes Total*: The total number of bytes both sent and received by the application to and from machines on this network or this Corente Client during the 5-second interval.
The Statistics History on Application page displays graphs of the traffic (in bytes) sent and received by the application per 5-second interval from each network that is connected to the application. The first graph details the traffic sent by the application, the second graph details the traffic received by the application, and the third graph details the total amount of traffic both sent by and received by the application.
The data on this screen is captured as you view both this screen and the application's Detailed Information on Application screen. If you move to another screen, the graphs may be reset to allow the Location gateway's resources to be utilized more effectively. You must remain on these pages to collect the amount of historical data that you need.
These graphs can provide up to 24 hours worth of information (the most recently captured data always appears on the right side of each graph). The total duration of the historical data that you have captured in the graphs is displayed in the heading of this page. As time passes, you will be able to view the graphs in shorter time increments (the last 10 minutes, the last 30 minutes, etc.) by using the links that also appear in heading of this page. The graph increment that you are currently viewing is displayed in bold white characters.
If you modify the refresh rate on this page by selecting the refresh icon, you will not be able to set the refresh rate to intervals greater than every 10 minutes. If your refresh rate is already set to intervals greater than 10 minutes, it will automatically be changed to refresh every 10 minutes.
If you select the Show History hyperlink from the Active Connections interface, you can view historical graphs of the application traffic broken down per connected client rather than per connected network.
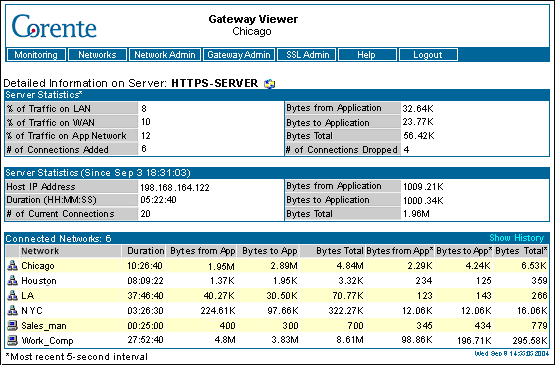
The Detailed Information on Server page displays statistics and connection information about the server that you have selected from a Detailed Information on Application page. A single server on your network can provide multiple applications via the Corente Virtual Services Gateway.
The Server Statistics table displays statistics from the last 5 second interval. This 5-second interval is the 5 seconds preceding the date and time that the page was last refreshed (i.e., the date and time displayed at the bottom of the page). If the number of bytes recorded in a category on this table exceeds 1024, the number of bytes will be rounded off and listed in K(ilobytes), M(egabytes), G(igabytes), etc.
% of Traffic on LAN: The percent of the total traffic on the LAN during the 5-second interval that consisted of traffic to and from this server.
% of Traffic on WAN: The percent of the total traffic on the WAN during the 5-second interval that consisted of traffic to and from this server. The WAN includes Internet traffic and alternate connection traffic (i.e., non-Corente-network site-to-site traffic).
% of Traffic on App Network: The percent of the total traffic on the Corente network during the 5-second interval that consisted of traffic to and from this server.
Bytes from Server: The total number of bytes sent from the server to machines with active connections during the 5-second interval.
Bytes to Server: The total number of bytes sent to the server from machines with active connections during the 5-second interval.
Bytes Total: The total number of bytes both sent and received by the server during the 5-second interval.
# of Connections Added: The number of connections that were added to this server during the 5-second interval.
# of Connections Dropped: The number of connections that were dropped from this server during the 5-second interval.
The Server Statistics table displays address, protocol, and traffic information about the selected server. If the number of bytes recorded in a category on this table exceeds 1024, the number of bytes will be rounded off and listed in K(ilobytes), M(egabytes), G(igabytes), etc.
Host IP Address: The IP address of this server.
Duration (HH:MM:SS): The amount of time between the date/time displayed in the heading of this section (the date/time that the server established its current UP status) and the date/time displayed at the bottom of the page (the date/time the page was last refreshed). The statistics within this section have all been collected during this duration.
# of Current Connections: The total number of connections that have been established to this server since the date/time displayed in the heading of this section.
Bytes from Server: The total number of bytes sent from the server to machines with active connections since the last time the Location gateway was started (i.e., the date/time displayed in the heading of this section).
Bytes to Server: The total number of bytes sent to the server from machines with active connections since the last time the Location gateway was started (i.e., the date/time displayed in the heading of this section).
Bytes Total: The total number of bytes both sent and received by this server since the last time the Location gateway was started (i.e., the date/time displayed in the heading of this section).
The Connected Networks table lists all of the networks with machines that are currently connected to this server. The total number of current connected networks is displayed in the title of the table. Click the Show History hyperlink to display the Statistics History on Server page and view historical graphs of all active partner connections to this server. If there are more than ten connected networks, an additional hyperlink will be displayed: click the Top Ten hyperlink to view historical graphs of only the top 10 network bandwidth users (based on the total number of bytes sent and received by the server to/from each network). If the number of bytes recorded in a category on this table exceeds 1024, the number of bytes will be rounded off and listed in K(ilobytes), M(egabytes), G(igabytes), etc.
Network: The name of the Corente Virtual Services Gateway whose network has active connections with this server. If the Location gateway is within another Corente domain and has an extranet connection with the local Location gateway, this entry will contain the Location gateway's full name (i.e.,
domainname.gatewayname). Select an entry in this column to view the Active Connections (by client IP address) on this network to the server.NoteThe icon to the right of each entry in this column indicates whether the entry is a network (
 ) or a Remote Corente Client (
  ). If this entry is a Corente Client, when the entry
is selected, the Active Connections page will display the statistics for a single
computer (i.e., the Corente Client itself).
 Duration (HH:MM:SS): The total duration of this network or Corente Client's connection to the server.
Bytes from Srv: The total number of bytes sent from the server to machines on this network or to this Corente Client since the last time the Location gateway was started (i.e., the date/time displayed in the heading of the Server Statistics section).
Bytes to Srv: The total number of bytes sent to the server from the machines on this network or from this Corente Client since the last time the Location gateway was started (i.e., the date/time displayed in the heading of the Server Statistics section).
Bytes Total: The total number of bytes both sent and received the server to and from the machines on this network or Corente Client since the last time the Location gateway was started (i.e., the date/time displayed in the heading of the Server Statistics section).
Bytes from Srv*: The total number of bytes sent from the server to the machines on this network or to this Corente Client during the 5-second interval.
Bytes to Srv*: The total number of bytes sent to the server from the machines on this network or from this Corente Client during the 5-second interval.
Bytes Total*: The total number of bytes both sent and received by the server to and from the machines on this network or this Corente Client during the 5-second interval.
The Statistics History on Server page displays graphs of the traffic (in bytes) sent and received by the server per 5-second interval from each network that is connected to the server. The first graph details the traffic sent by the server, the second graph details the traffic received by the server, and the third graph details the total amount of traffic both sent by and received by the server.
The data on this screen is captured as you view both this screen and the server's Detailed Information on Server screen. If you move to another screen, the graphs may be reset to allow the Location gateway's resources to be utilized more effectively. You must remain on these pages to collect the amount of historical data that you would like.
These graphs can provide up to 24 hours worth of information (the most recently captured data always appears on the right side of each graph). The total duration of the historical data that you have captured in the graphs is displayed in the heading of this page. As time passes, you will be able to view the graphs in shorter time increments (the last 10 minutes, the last 30 minutes, etc.) by using the links that also appear in heading of this page. The graph increment that you are currently viewing is displayed in bold white characters.
If you modify the refresh rate on this page by selecting the refresh icon, you will not be able to set the refresh rate to intervals greater than every 10 minutes. If your refresh rate is already set to intervals greater than 10 minutes, it will automatically be changed to refresh every 10 minutes.
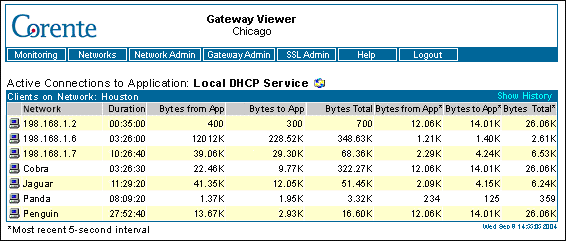
When you select the name of a Corente Virtual Services Gateway on the Detailed Information on Application page, the Active Connections page will be displayed. This page will list all of the clients behind that Corente Virtual Services Gateway that currently have active connections to the application. The total number of connected clients behind the Location gateway is displayed at the top of the page.
Click the Show History hyperlink to display the Statistics History on Application page and view historical graphs of all active connections to this application per client. If the number of bytes recorded in a category on this page exceeds 1024, the number of bytes will be rounded off and listed in K(ilobytes), M(egabytes), G(igabytes), etc.
Source: The DNS name or IP address of the machine that currently has an active connection to the application.
Duration: The duration of the machine's current connection to the application.
Bytes from App: The total number of bytes sent from the application to this machine since you first accessed this page.
Bytes to App: The total number of bytes sent to the application from this machine since you first accessed this page.
Bytes Total: The total number of bytes both sent and received by the application to/from this machine since you first accessed this page.
ImportantThe data for the Bytes from App, Bytes to App, and Bytes Total fields on this screen is captured as you view this screen. If you move to another screen, the data on this screen may be reset to allow the Location gateway's resources to be utilized more effectively. You must remain on this page to collect the amount of data in these fields that you would like.
Bytes from App*: The total number of bytes sent from the application to this machine during the last 5-second interval. This 5-second interval is the 5 seconds preceding the date and time that the page was last refreshed (i.e., the date and time displayed at the bottom of the page).
Bytes to App*: The total number of bytes sent to the application from this machine during the 5-second interval.
Bytes Total*: The total number of bytes both sent and received by the server to/from this machine during the 5-second interval.
The Statistics History on Application (Client Statistics) page displays graphs of the traffic (in bytes) sent and received by the application per 5-second interval from each machine that is connected to the application from a specific Corente Virtual Services Gateway's LAN. The first graph details the traffic sent from the application to each client, the second graph details the traffic sent to the application from each client, and the third graph details the total amount of traffic both sent and received by the application to/from each client.
The data on this screen is captured as you view both this screen and the Active Connections screen. If you move to another screen, the graphs may be reset to allow the Location gateway's resources to be utilized more effectively. You must remain on these pages to collect the amount of historical data that you would like.
These graphs can provide up to 24 hours worth of information (the most recently captured data always appears on the right side of each graph). The total duration of the historical data that you have captured in the graphs is displayed in the heading of this page. As time passes, you will be able to view the graphs in shorter time increments (the last 10 minutes, the last 30 minutes, etc.) by using the links that also appear in heading of this page. The graph increment that you are currently viewing is displayed in bold white characters.
If you modify the refresh rate on this page by selecting the refresh icon, you will not be able to set the refresh rate to intervals greater than every 10 minutes. If your refresh rate is already set to intervals greater than 10 minutes, it will automatically be changed to refresh every 10 minutes.
When you select the name of a Corente Virtual Services Gateway on the Detailed Information on Server page, the Active Connections page will be displayed. This page will list all of the clients behind that Corente Virtual Services Gateway that currently have active connections to the server. The total number of connected clients behind the Location gateway is displayed at the top of the page.
Click the Show History hyperlink to display the Statistics History on Server page and view historical graphs of all active connections to this application per client.
If the number of bytes recorded in a category on this page exceeds 1024, the number of bytes will be rounded off and listed in K(ilobytes), M(egabytes), G(igabytes), etc.
Source: The DNS name or IP address of the machine that currently has an active connection to the server.
Duration: The duration of this machine's current connection to the server.
Bytes from Srv: The total number of bytes sent from the server to this machine since you first accessed this page.
Bytes to Srv: The total number of bytes sent to the server from this machine since you first accessed this page.
Bytes Total: The total number of bytes both sent and received by the server to/from this machine since you first accessed this page.
ImportantThe data for the Bytes from Srv, Bytes to Srv, and Bytes Total fields on this screen is captured as you view this screen. If you move to another screen, the data on this screen may be reset to allow the Location gateway's resources to be utilized more effectively. You must remain on this page to collect the amount of data in these fields that you would like.
Bytes from Srv*: The total number of bytes sent from the server to this machine during the last 5-second interval. This 5-second interval is the 5 seconds preceding the date and time that the page was last refreshed (i.e., the date and time displayed at the bottom of the page).
Bytes to Srv*: The total number of bytes sent to the server from this machine during the 5-second interval.
Bytes Total*: The total number of bytes both sent and received by the server to/from this machine during the 5-second interval.
The Statistics History on Server (Client Statistics) page displays graphs that detail the traffic (in bytes) sent and received by the server per 5-second interval from each machine that is connected to the server from a specific Corente Virtual Services Gateway's LAN. The first graph details the traffic sent from the server to each client, the second graph details the traffic sent to the server from each client, and the third graph details the total amount of traffic both sent and received by the server to/from each client.
The data on this screen is captured as you view both this screen and the Active Connections screen. If you move to another screen, the graphs may be reset to allow the Location gateway's resources to be utilized more effectively. You must remain on these pages to collect the amount of historical data that you would like.
These graphs can provide up to 24 hours worth of information (the most recently captured data always appears on the right side of each graph). The total duration of the historical data that you have captured in the graphs is displayed in the heading of this page. As time passes, you will be able to view the graphs in shorter time increments (the last 10 minutes, the last 30 minutes, etc.) by using the links that also appear in heading of this page. The graph increment that you are currently viewing is displayed in bold white characters.
If you modify the refresh rate on this page by selecting the refresh icon, you will not be able to set the refresh rate to intervals greater than every 10 minutes. If your refresh rate is already set to intervals greater than 10 minutes, it will automatically be changed to refresh every 10 minutes.
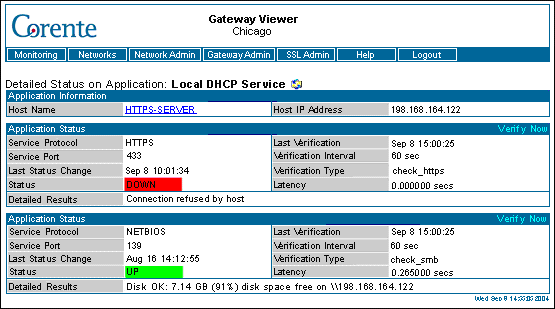
The Detailed Status page displays status information about the application or service that you have selected. The status of each protocol used by the application or service is presented in a separate table on this page.
The Application Information table displays identity information about the server being monitored.
Host Name: The DNS name of the server that is providing the application/service. If you are viewing the detailed status of an application (rather than a service), the entry in this field can be selected to display the Detailed Server Information page for this server.
Host IP Address: The IP address of the server that is providing the application/service.
The following information is displayed for each protocol of the application/service:
Service Protocol: The protocol used by machines to connect to this application/service. Each protocol employed by the application/service will have its own table on this page, with its own corresponding status information.
Service Port: The port number on the server used by machines to connect to the application/service with the Service Protocol.
Status: The summarized status of the Service Protocol.
Last Status Change: The date and time that the Service Protocol changed to its current Status.
Last Verification: The last date and time that the current status of the Service Protocol was verified.
Verification Interval: The period of time between automatic status verifications.
Verification Type: The type of test that the Location gateway will perform to verify the status of the Service Protocol. This test is chosen when registering the application/service with the Location gateway in App Net Manager.
Latency: The average latency of Service Protocol packets sent to and from the application/service as determined by the verification test.
Detailed Results: The detailed results of the verification test. The information provided in this field depends upon the Verification Type that has been configured for this Service Protocol. This field can be used to analyze and diagnose any problems with the application/service or its connection.
The Verify Now hyperlink at the top of each table can be used to verify the status of that table's Service Protocol immediately. This hyperlink can be used instead of waiting for the next automatic verification.
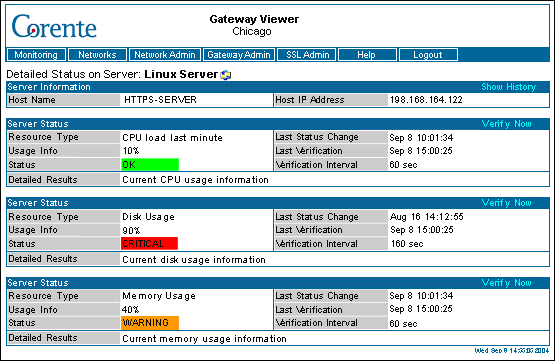
The Detailed Status on Server page displays usage information about resources on the server that you have selected.
The Server Information table displays identity information about the server being monitored.
Host Name: The DNS name of the server.
Host IP Address: The IP address of the server.
Show History: Click this hyperlink to display the Status History on Server page for this server, which presents a historical graph of utilization for all resources that are being monitored on this page.
The following information is displayed for each resource that an administrator in App Net Manager has selected to be monitored on this server:
Resource Type: The resource whose status is displayed in this table. Possible resources are: CPU Load (in the last minute), Disk Space Usage, Memory Usage, and Swap Space Usage.
Usage Info: The percentage of this resource being used on the server.
Status: The summarized status of this resource on the server.
Last Status Change: The date and time that the resource on the server changed to its current Status.
Last Verification: The last date and time that the current status of the resource on the server was verified.
Verification Interval: The period of time between automatic status verifications.
Detailed Results: Additional information about the resource.
The Verify Now hyperlink at the top of each table can be used to verify the status of that resource immediately. This hyperlink can be used instead of waiting for the next automatic verification.
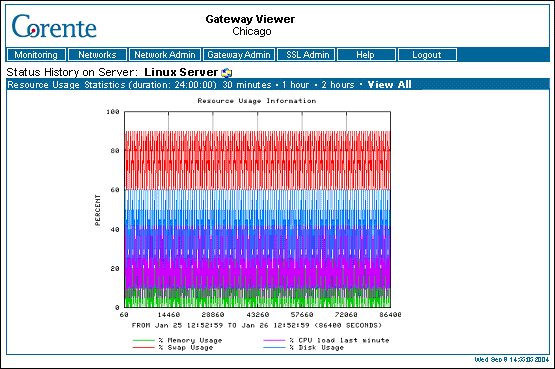
The Status History on Server page displays a graph that details the percent utilization of resources that are being monitored for the server on the Detailed Status on Server page. Usage of the following resources may be displayed on the graph: CPU, memory, swap space, and disk space. Usage of each resource is graphed using a different colored line.
The data on this screen is captured as you view this screen. If you move to another screen, the graphs may be reset to allow the Location gateway's resources to be utilized more effectively. You must remain on these pages to collect the amount of historical data that you would like.
The graph can provide up to 24 hours worth of information (the most recently captured data always appears on the right side of the graph). The total duration of the historical data that you have captured is displayed in the heading of this page. As time passes, you will be able to view the graph in shorter time increments (the last 30 minutes, the last hour, etc.) by using the links that also appear in the heading of this page. The graph increment that you are currently viewing is displayed in bold white characters.
If you would like to provide users with information about an application or its status, you can add a comment to the users' Monitoring page by selecting the entry in that application's Comments field and entering information on this page.
Comment: Enter the comment in this field. You may use up to 50 characters.
Valid for: Select the period of time that this comment will be displayed on the Monitoring page. Enter a value in this field and select Minutes, Hours, Days, Months, or Years. When this period of time has expired, the comment will no longer be displayed.
When you have completed these fields, click the Submit button. If there is a current comment that has not yet expired for the application, that comment will be replaced by this new comment. To clear the fields and start again, click the Reset button.


