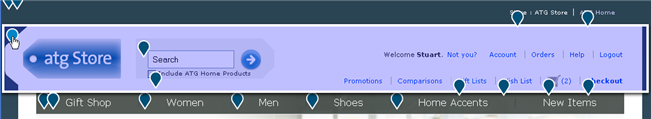
When you hover your cursor over an action marker, a blue overlay appears on the area of the page that the action marker applies to. For example:
When you click on an action marker, the left side of the toolbar displays a list of the events associated with that marker. For example:
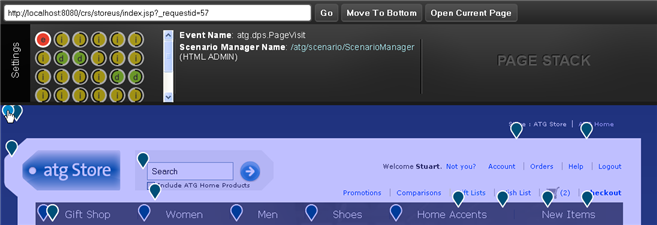
The icons for the events may include:
 and
and  -- Opening and closing
 <dsp:droplet>tags and
and  -- Opening and closing
 <dsp:include>tags and
and  -- Opening and closing
 <dsp:form>tags -- Scenario event
 -- Scenario action
The order in which the icons are displayed reflects their nesting relationship, which can be quite complex (for example, multiple levels of nested servlet beans containing multiple levels of page includes).
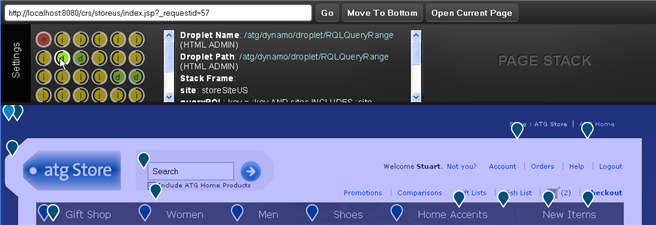
The central area of the toolbar initially displays information associated with the first icon in the list. You can display information about a different icon by clicking on it. For example:
The sections that follow summarize the data displayed for each type of Fluoroscope event.
