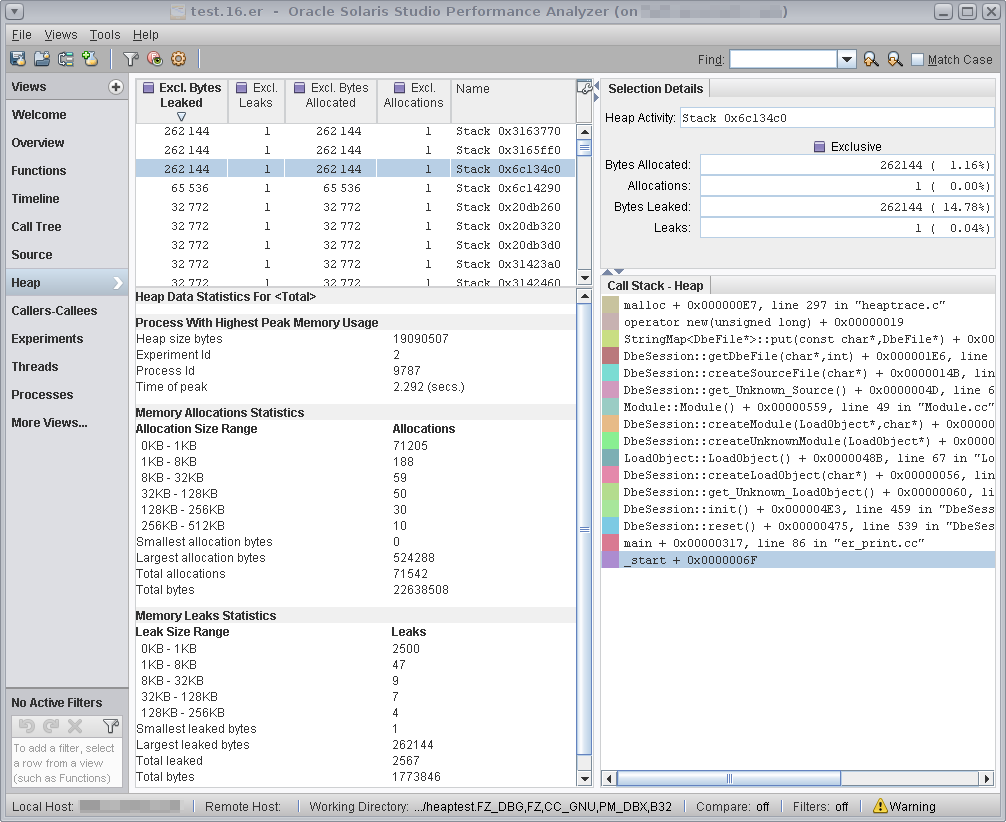
New Heap Data View
A new Heap view shows possible memory leaks in your program. The view is available if you profiled your application for heap tracing data from Performance Analyzer, or using the collect -H on command.
The Heap view shows a list of call stacks that have memory allocation metrics which indicate possible memory leaks. Timeline now shows the size of the allocated heap as a function of time. A new Data Size view is available that shows the distribution of allocations and leaks by number of bytes. A new Duration view is available for analyzing the duration of allocations. See the Help in the Performance Analyzer for more information about the Heap view.
Figure 3-11 New Heap Data View
