Dashboard
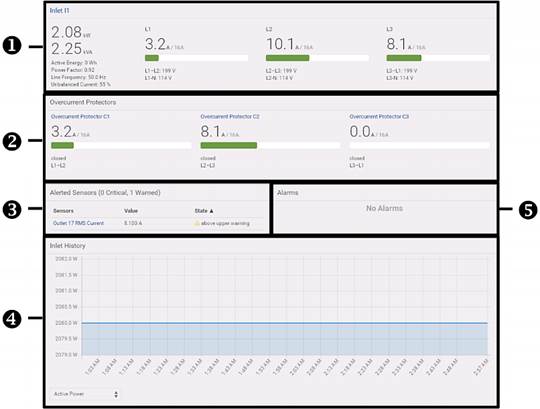
The Dashboard page contains four to five sections, depending on the HPDU
model.

|
|
|
|
1
|
Inlet I1
|
Overview of inlet power data for each phase, represented by a
bar that changes colors to indicate the current RMS
state.
-
Green: Normal
-
Yellow: Warning
-
Red: Critical
|
|
2
|
Overcurrent Protectors
|
Displays an overview of each OCP status only when the HPDU
contains overcurrent protectors (OCPs).
A current bar per OCP changes colors to indicate the current
RMS state.
-
Green: Normal
-
Yellow: Warning
-
Red: Critical
|
|
3
|
Alerted Sensors
|
When any sensor enters the alarmed state, this section lists
all alerted sensors.
When no sensors enter the alarmed state, this section
displays, No Alerted Sensors.
|
|
4
|
Inlet History
|
The chart of the inlet active power history displays, by
default. You also can display a different data type.
|
|
5
|
Alarms
|
Displays alarm data only after you set event rules requiring
users to take the acknowledgment action.
When there are unacknowledged events, this section lists all
of them.
When there are no unacknowledged events, this section shows
the message, No Alarms.
|
|

