1.2 Server Diagnostics Overview
There are a variety of diagnostic tools, commands, and indicators you can use to monitor and troubleshoot a server:
LEDs – These indicators provide a quick visual notification of the status of the server and of some of the FRUs.
Fault management architecture – FMA provides simplified fault diagnostics through use of the /var/adm/messages file, the fmdump command, and a Sun Microsystems web site.
ILOM firmware – This system firmware runs on the service processor. In addition to providing the interface between the hardware and OS, ILOM also tracks and reports the health of key server components. ILOM works closely with POST and Solaris Predictive Self-Healing technology to keep the system up and running even when there is a faulty component.
Power-on self-test (POST) – POST performs diagnostics on system components upon system reset to ensure the integrity of those components. POST is configurable and works with ILOM to take faulty components offline if needed.
Solaris OS Predictive Self-Healing (PSH) – This technology continuously monitors the health of the CPU and memory, and works with ILOM to take a faulty component offline if needed. The Predictive Self-Healing technology enables Sun systems to accurately predict component failures and mitigate many serious problems before they occur.
Log files and console messages – These provide the standard Solaris OS log files and investigative commands that can be accessed and displayed on the device of your choice.
SunVTS™ – An application that exercises the system, provides hardware validation, and discloses possible faulty components with recommendations for repair.
The LEDs, ILOM, Solaris OS PSH, and many of the log files and console messages are integrated. For example, a fault detected by the Solaris software will display the fault, log it, pass information to ILOM where it is logged, and depending on the fault, might light one or more LEDs.
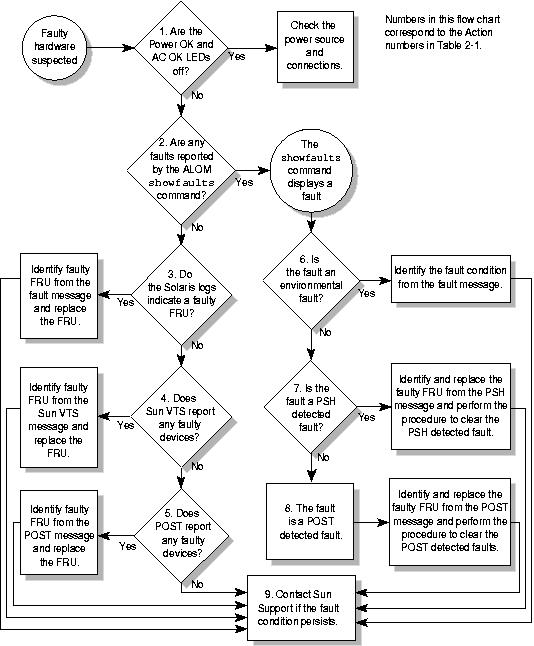
The diagnostic flowchart in Diagnostic Flowchart and Diagnostic Flowchart Actions describes an approach for using the server diagnostics to identify a faulty field-replaceable unit (FRU). The diagnostics you use, and the order in which you use them, depend on the nature of the problem you are troubleshooting. So you might perform some actions and not others.
The flowchart assumes that you have already performed some rudimentary troubleshooting such as verification of proper installation, visual inspection of cables and power, and possibly performed a reset of the server (refer to the server installation guide and server administration guide for details).
Use this flowchart to understand what diagnostics are available to troubleshoot faulty hardware. Use Diagnostic Flowchart Actions to find more information about each diagnostic in this chapter.
Figure 1-1 Diagnostic Flowchart

|
1.2.1 Memory Configuration and Fault Handling
A variety of features play a role in how the memory subsystem is configured and how memory faults are handled. Understanding the underlying features helps you identify and repair memory problems. This section describes how the memory is configured and how the server deals with memory faults.
1.2.1.1 Memory Configuration
In the server memory there are 16 slots that hold DDR-2 memory FB-DIMMs in the following FB-DIMM sizes:
1 Gbyte (maximum of 32 Gbyte)
2 Gbyte (maximum of 64 Gbyte)
4 Gbyte (maximum of 128 Gbyte)
8 Gbyte (maximum of 256 Gbyte)
FB-DIMMs are installed in groups of 8, called ranks (ranks 0 and 1). At minimum, rank 0 must be fully populated with eight FB-DIMMs of the same capacity. A second rank of FB-DIMMs of the same capacity can be added to fill rank 1.
See Servicing FB-DIMMs for instructions about adding memory to a server.
1.2.1.2 Memory Fault Handling
The server uses an advanced ECC technology, called chipkill, that corrects up to 4 bits in error on nibble boundaries, as long as all of the bits are in the same DRAM. If a DRAM fails, the FB-DIMM continues to function.
The following server features independently manage memory faults:
POST – Based on ILOM configuration variables, POST runs when the server is powered on.
For correctable memory errors (CEs), POST forwards the error to the Solaris Predictive Self-Healing (PSH) daemon for error handling. If an uncorrectable memory fault is detected or if a “storm” of CEs is detected, POST displays the fault with the device name of the faulty FB-DIMMs, logs the fault, and disables the faulty FB-DIMMs by placing them in the ASR blacklist. Depending on the memory configuration and the location of the faulty FB-DIMM, POST disables half of physical memory in the system, or half the physical memory and half the processor threads. When this offlining process occurs in normal operation, you must replace the faulty FB-DIMMs based on the fault message. You then must enable the disabled FB-DIMMs with the ALOM CMT CLI enablecomponent command.
Solaris Predictive Self-Healing (PSH) technology – A feature of the Solaris OS, uses the fault manager daemon (fmd) to watch for various kinds of faults. When a fault occurs, the fault is assigned a unique fault ID (UUID), and logged. PSH reports the fault and provides a recommended proactive replacement for the FB-DIMMs associated with the fault.
1.2.1.3 Troubleshooting Memory Faults
If you suspect that the server has a memory problem, follow the flowchart (Diagnostic Flowchart). Run the ALOM CMT compatability CLI (in ILOM) showfaults command, see Interacting With the Service Processor and Detecting Faults. The showfaults command lists memory faults and lists the specific FB-DIMMS that are associated with the fault. Once you identify which FB-DIMMs to replace, see Servicing FB-DIMMs for FB-DIMM replacement instructions. You must perform the instructions in that chapter to clear the faults and enable the replaced FB-DIMMs.